«What's the first KPI you look at when taking over a struggling network?
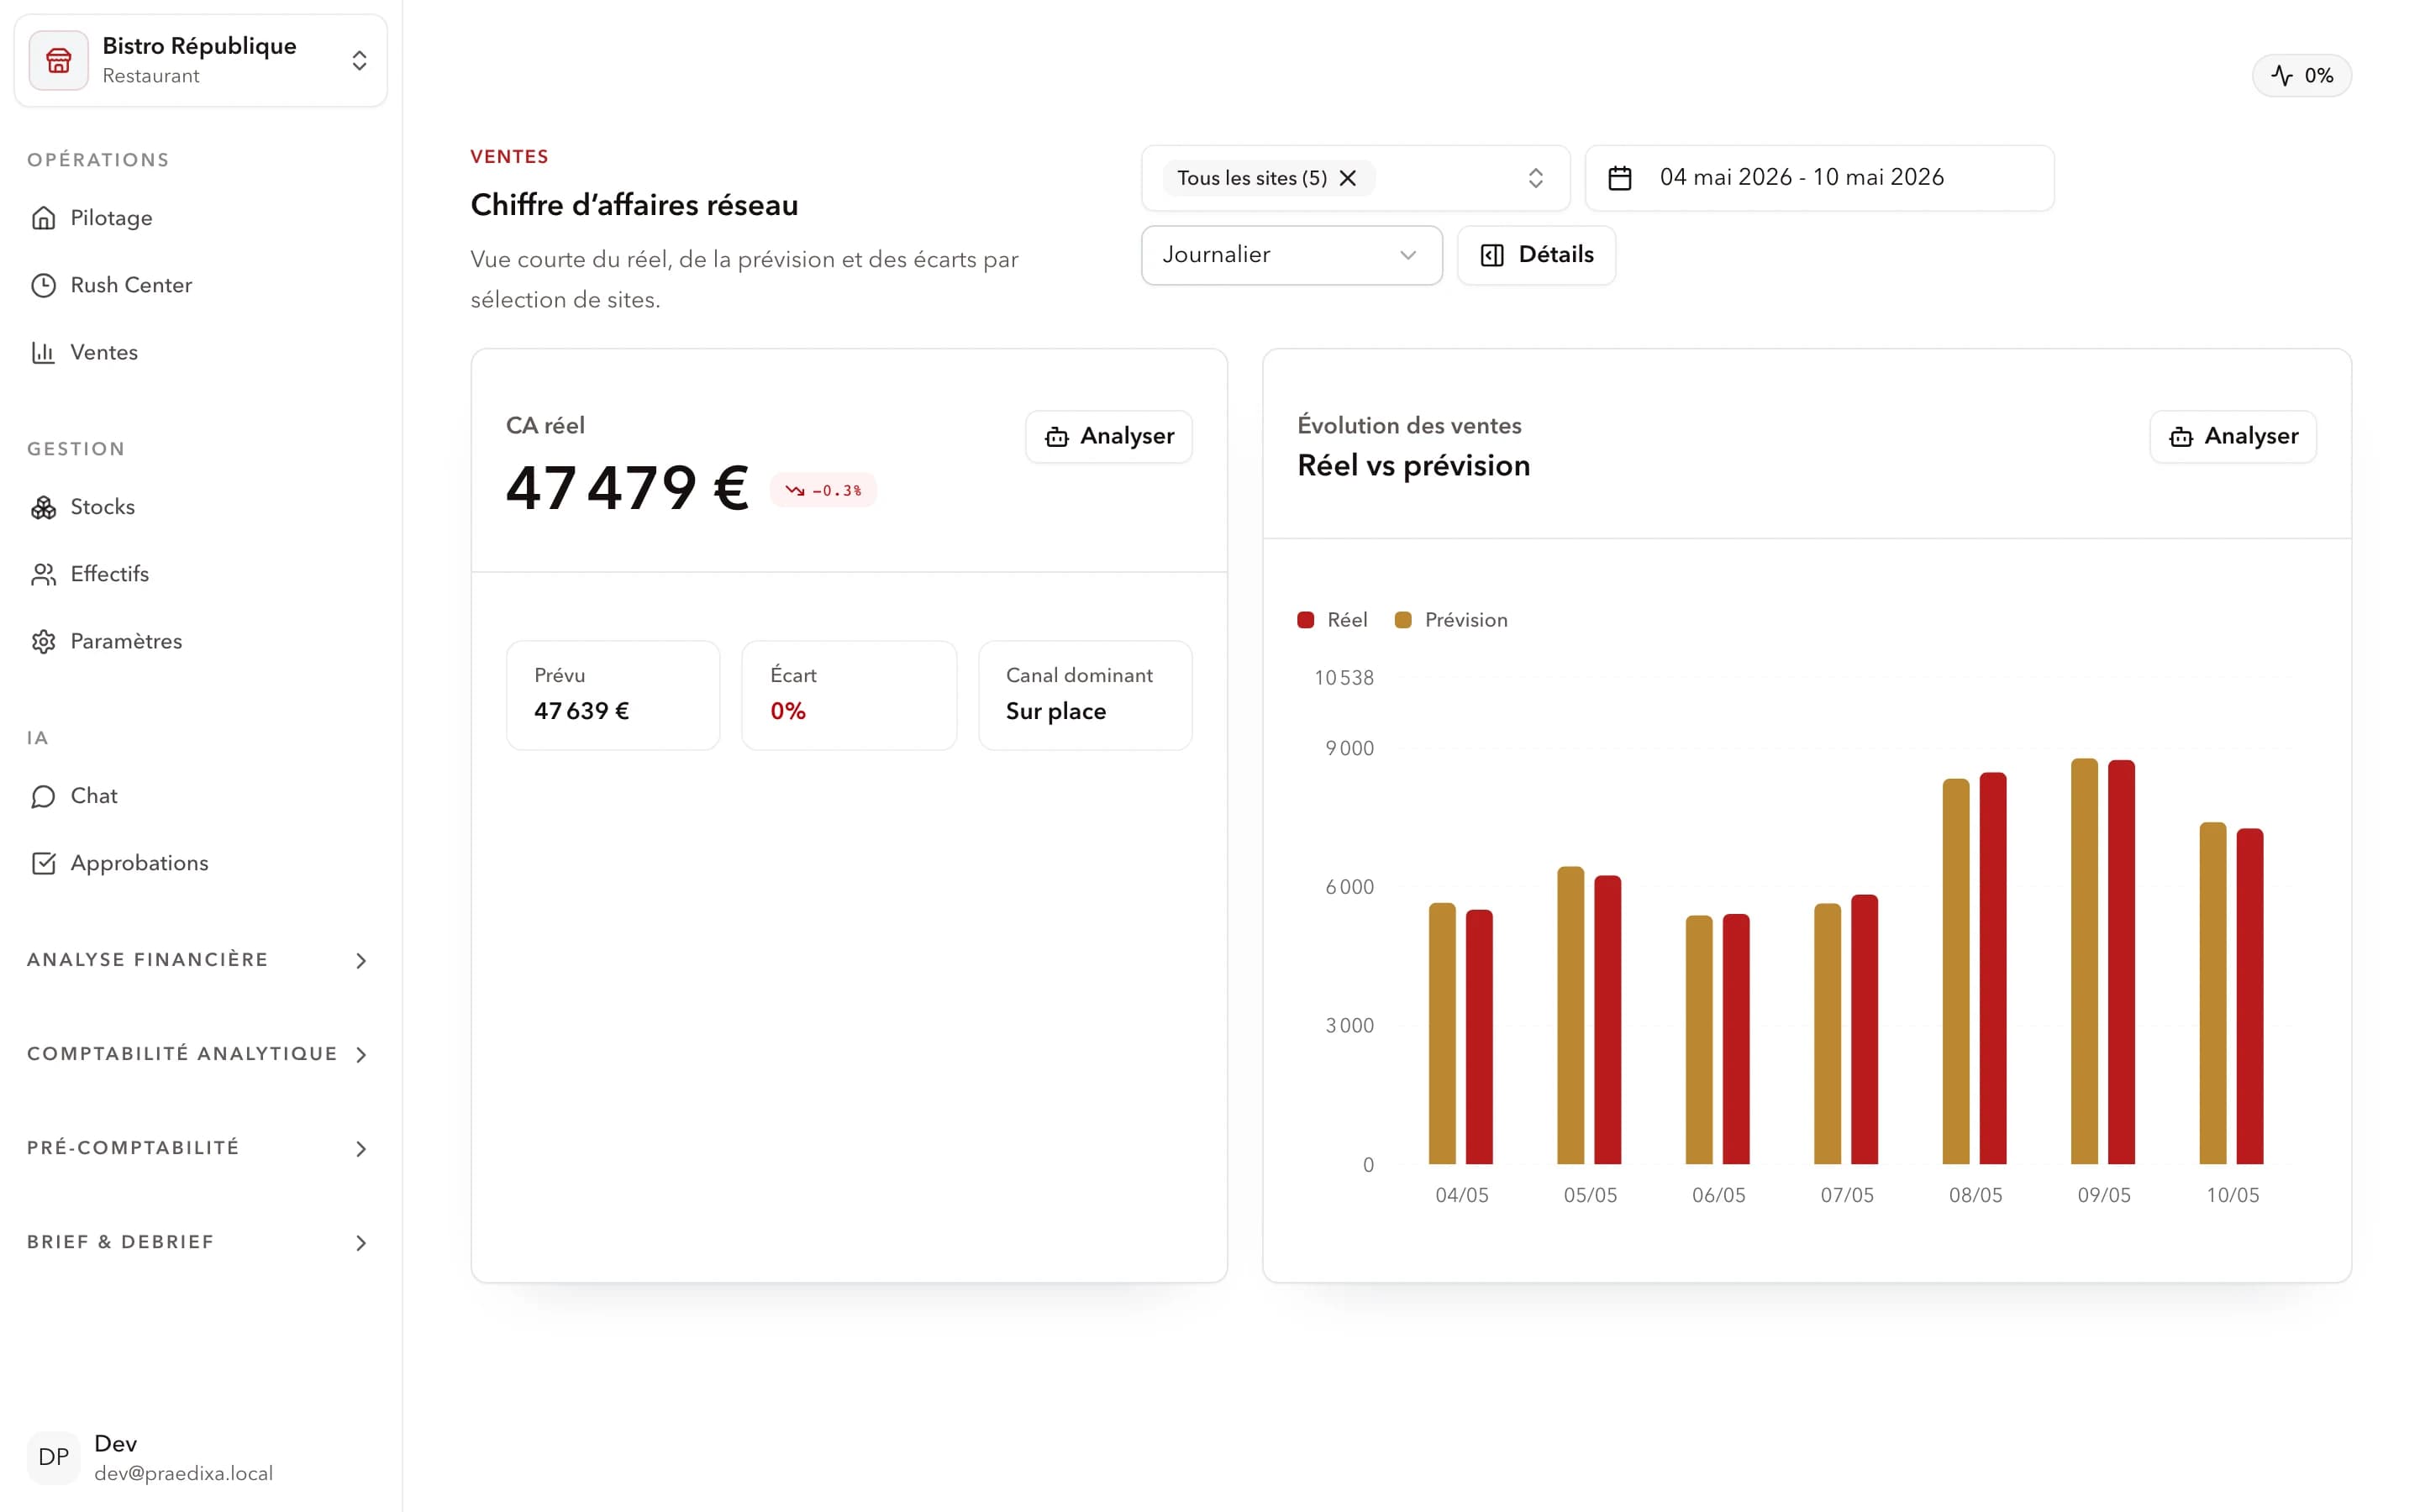
Forecast-vs-actual variance per service, smoothed over 4 weeks. Not aggregated food cost, not aggregated labor — variance per service. It's the only KPI revealing whether the network is steering or reacting. A chronic +/-15% variance on dinner service means everything downstream (orders, schedule, production) is calibrated on false assumptions. Before touching food cost, I want to know if the demand signal is reliable.
— Steven Poivre, CEO & Data Scientist — Time Series and Demand Forecasting Expert
«How long does it really take to deploy a tool like Praedixa on 15 sites?
21 days with clean execution, provided the POS is centralized and historical data is available. Concretely: week 1 POS integration + data quality audit, week 2 per-site threshold configuration + manager training, week 3 progressive go-live site by site. Deployments that drag 3 months always suffer the same issue: heterogeneous POS across sites, non-harmonized product categories, or an owner who wants every module deployed at once instead of wedging with forecasting.
«What's the most frequent steering mistake among multi-site ops directors?
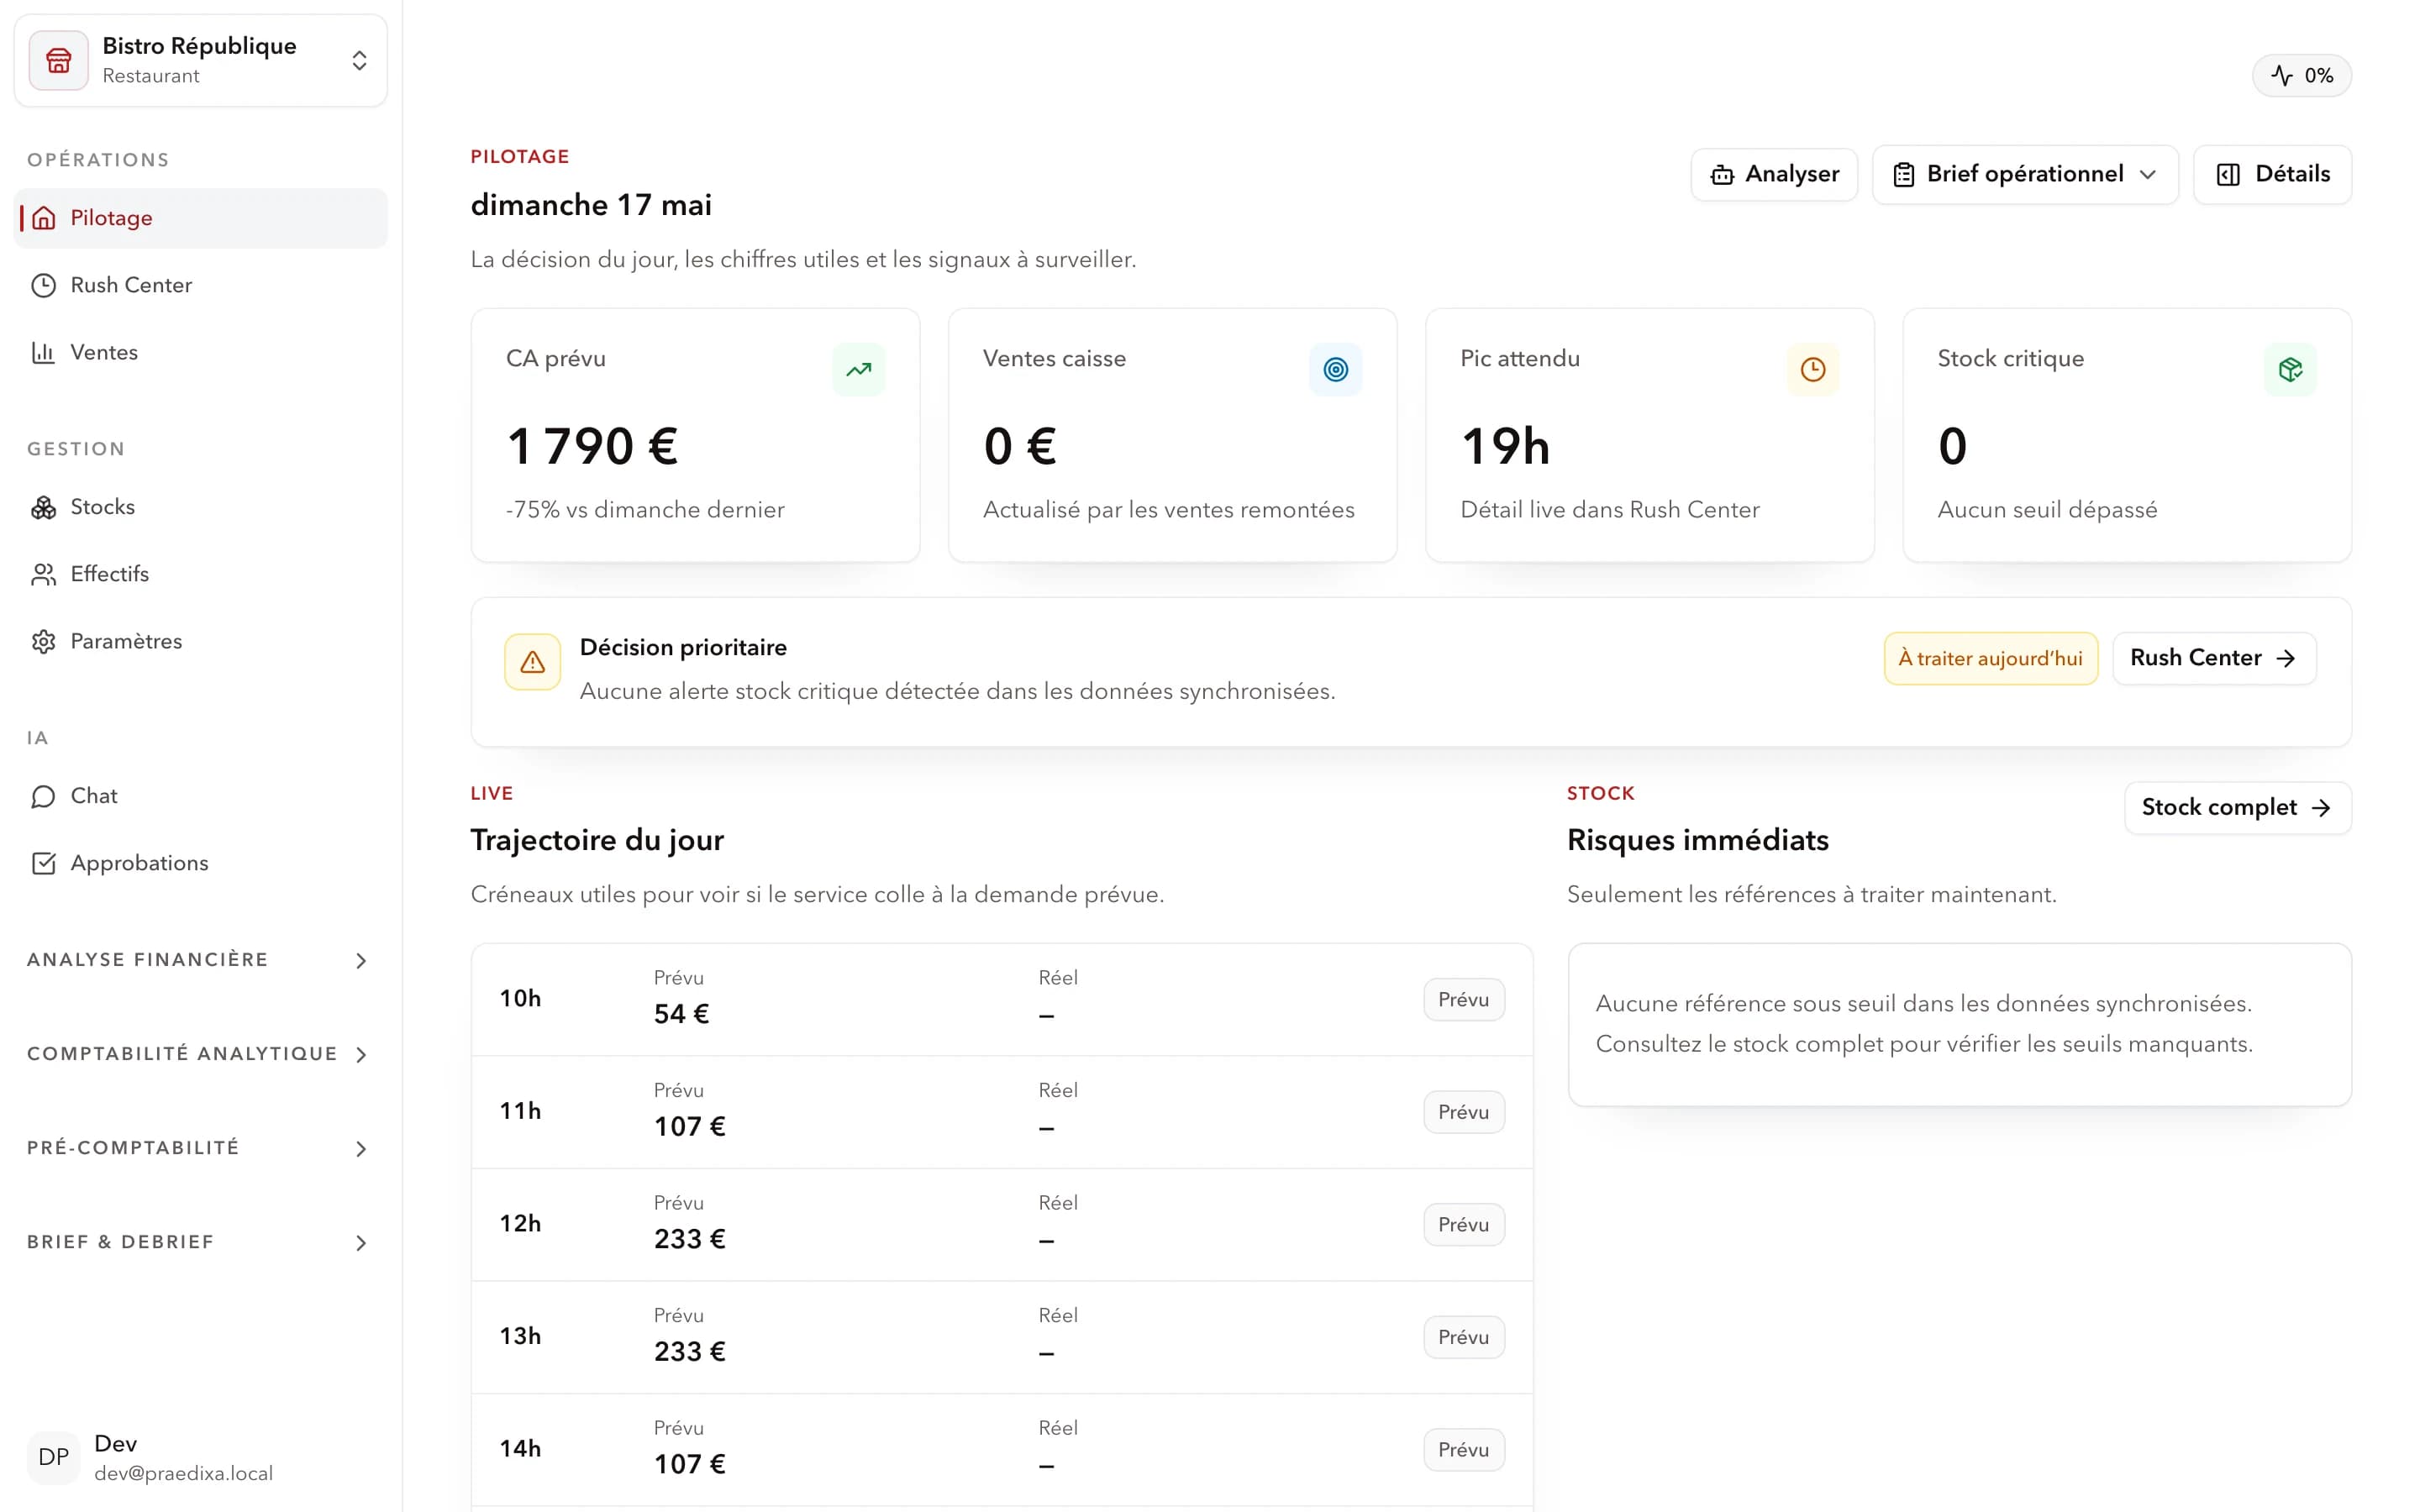
Confusing reporting with steering. The average ops director gets a beautiful Monday dashboard consolidating last week's numbers — but the site manager never sees that dashboard, and Thursday-night drift can no longer be corrected. Real steering is an alert landing on the manager's phone 4 hours before service, not a weekly report sent to HQ.