Resources 2026

Multi-site restaurant management: how to centralize without losing field control

Demand forecasting, inventory, labor: how restaurant networks steer multi-site operations in 2026. Tools comparison, method and pilot use cases.

Praedixa network steering dashboard with consolidated KPIs across a multi-site restaurant network
Praedixa network view: performance, alerts and cross-site variance consolidated in a single dashboard.

What is multi-site management in restaurants?

Multi-site management in restaurants is the set of methods and tools that allow a restaurant network to supervise, compare and optimize each location's performance from a central level. It covers financial performance (food cost, margins, revenue), operations (inventory, purchasing, production) and human resources (schedules, labor cost).

  • Compare site performance with a common reference framework.
  • Forecast demand and align labor and inventory per site.
  • Detect drifts in hours and trigger targeted field action.
Method

How to read this multi-site restaurant management: how to centralize without losing field control comparison

This guide is built for an operational decision, not for a feature checklist. In foodservice, operational steering of multi-site restaurant networks should be assessed by its ability to turn existing operational data into concrete tradeoffs: buying slightly less, reinforcing a team before a rush, preventing a likely stockout or protecting margin on a sensitive service.

The first question is therefore not simply: which tool has the best dashboard? The real question is: which tool helps a manager, franchisee or operations team decide before the issue is visible in the POS data? A good solution should connect POS, sales history, calendar, weather, inventory and scheduling data without forcing teams to replace their entire stack.

Praedixa focuses on an immediate operational challenge: forecasting demand and labor needs more accurately to reduce waste, stockouts, food cost and scheduling errors. The goal is simple: help teams make better decisions before service, with a measurable impact on margin.

Network steering 2026

The 4 operational challenges of multi-site restaurants

Multi-site restaurant management is nothing like running a single location. By 3 or 4 sites, complexity explodes. Four problems systematically hit networks that haven't structured their steering yet.

1 — Performance heterogeneity across sites

Two restaurants in the same network, same concept, same menu — but margins diverge by 8 points. Common. And without a consolidated multi-site restaurant dashboard, nobody sees it before it's too late.

Each site develops its own habits: non-standardized orders, locally-adapted recipes, differently-applied promotions. Financial coherence erodes gradually.

What's needed: a real-time comparative view, site by site, with automatic alerts on variance.

2 — Decisions made without consolidated data

Without centralization, reports arrive late — often weekly or monthly. Leadership never has a reliable, up-to-date view of the real situation. Result: partial, sometimes biased decisions. Steering by intuition rather than data.

What's needed: an automatic data flow from each POS, continuously updated, with no re-entry.

3 — Labor cost misaligned with actual demand

Restaurant scheduling software is often built from habit rather than real demand. One site overstaffed on Tuesday, understaffed on Friday night. Multiplied by 10 restaurants, the labor cost impact is massive.

Without restaurant demand forecasting site by site, schedules can't align with actual flow.

4 — Inventory and purchasing not synchronized

One site orders too much, another runs out. Inter-site transfers are not tracked. Recipes are not harmonized.

Restaurant inventory management across multi-site requires centralized synchronization: alert thresholds, automatic orders, consolidated inventory. Without this, waste and stockouts cost dearly — in margin and customer satisfaction.

Step 1 — Centralize the data (POS, inventory, HR)

Solid network steering doesn't happen by accident. Before any reporting, you need a reliable data foundation. Connect your sources: POS, inventory tools, HR. Data must flow automatically — no re-entry, no delay.

Concrete actions:

  • Audit existing tools at each site
  • Identify data silos (POS ≠ inventory ≠ HR)
  • Pick a central platform that aggregates everything via API
Sites table for a restaurant network with status, KPIs and per-location alerts in Praedixa
Centralization in Praedixa: every site, its KPIs and its alerts in a single view.

Step 2 — Standardize performance indicators

Each site calculates KPIs differently? Comparing margins or productivity becomes impossible. Multi-site reporting only has value if indicators are defined identically across the network.

KPIs to standardize first:

  • Average ticket per service and per site
  • Food cost (%) and labor cost (%)
  • Occupancy and table turnover
  • Theoretical vs actual inventory variance

Step 3 — Forecast demand site by site

This is where AI changes everything. Instead of planning by habit, top networks project demand at D+7 and D+30, per site, per service, per weekday.

Demand forecasting enables upstream alignment of:

  • Labor schedules with expected real flows
  • Supplier orders with projected needs
  • Inventory levels with anticipated consumption

Step 4 — Act in real time on variance

Centralized data and forecasts are worthless without fast action capability. The multi-site dashboard must trigger automatic alerts the moment a site drifts.

Actionable alert examples:

  • Site food cost exceeds target → immediate investigation
  • Friday-night traffic forecast +30% in Lyon → adjust the schedule
  • Key ingredient stock below critical threshold → trigger an order
Multi-site workforce view with aggregated timesheets and forecast labor needs per location
Consolidated labor — timesheets, sales and forecast labor needs per site in Praedixa.

Use case — 12-restaurant network, −18% operating costs in 60 days

This scenario is representative of results observed with a structured multi-site steering approach.

Context: a 12-restaurant fast-casual franchise network. Before centralized steering: schedules built from habit, supplier orders managed site by site, no consolidated network-level reporting.

Identified problems:

  • Food cost gap of 6 points between best and worst site
  • Labor cost oversized on Mondays and Tuesdays across 8 of 12 sites
  • Frequent stockouts on 3 key SKUs, waste on 5 others
Praedixa Finance & Optimization module with revenue, margin and cost structure for a network
Praedixa Finance module — consolidated revenue, margin and cost structure after network steering deployment.

What changed — 4-week method

Week 1 — Data centralization: POS + inventory + HR connection in a single platform.

Week 2 — KPI standardization: food cost, labor cost, average ticket — same definition across 12 sites.

Week 3 — Demand forecasting activated: schedules recalculated on expected real flows, supplier orders automatically adjusted.

Week 4 — Real-time alerts: drifts detected in hours.

Results at 60 days:

  • −18% in overall operating costs
  • −12% in labor cost (better staffing/demand alignment)
  • −22% in food waste (better-calibrated orders)
  • Food cost harmonized to ±1.5 points across all sites

Expert perspective

What is the first sign a network needs a centralized steering tool?

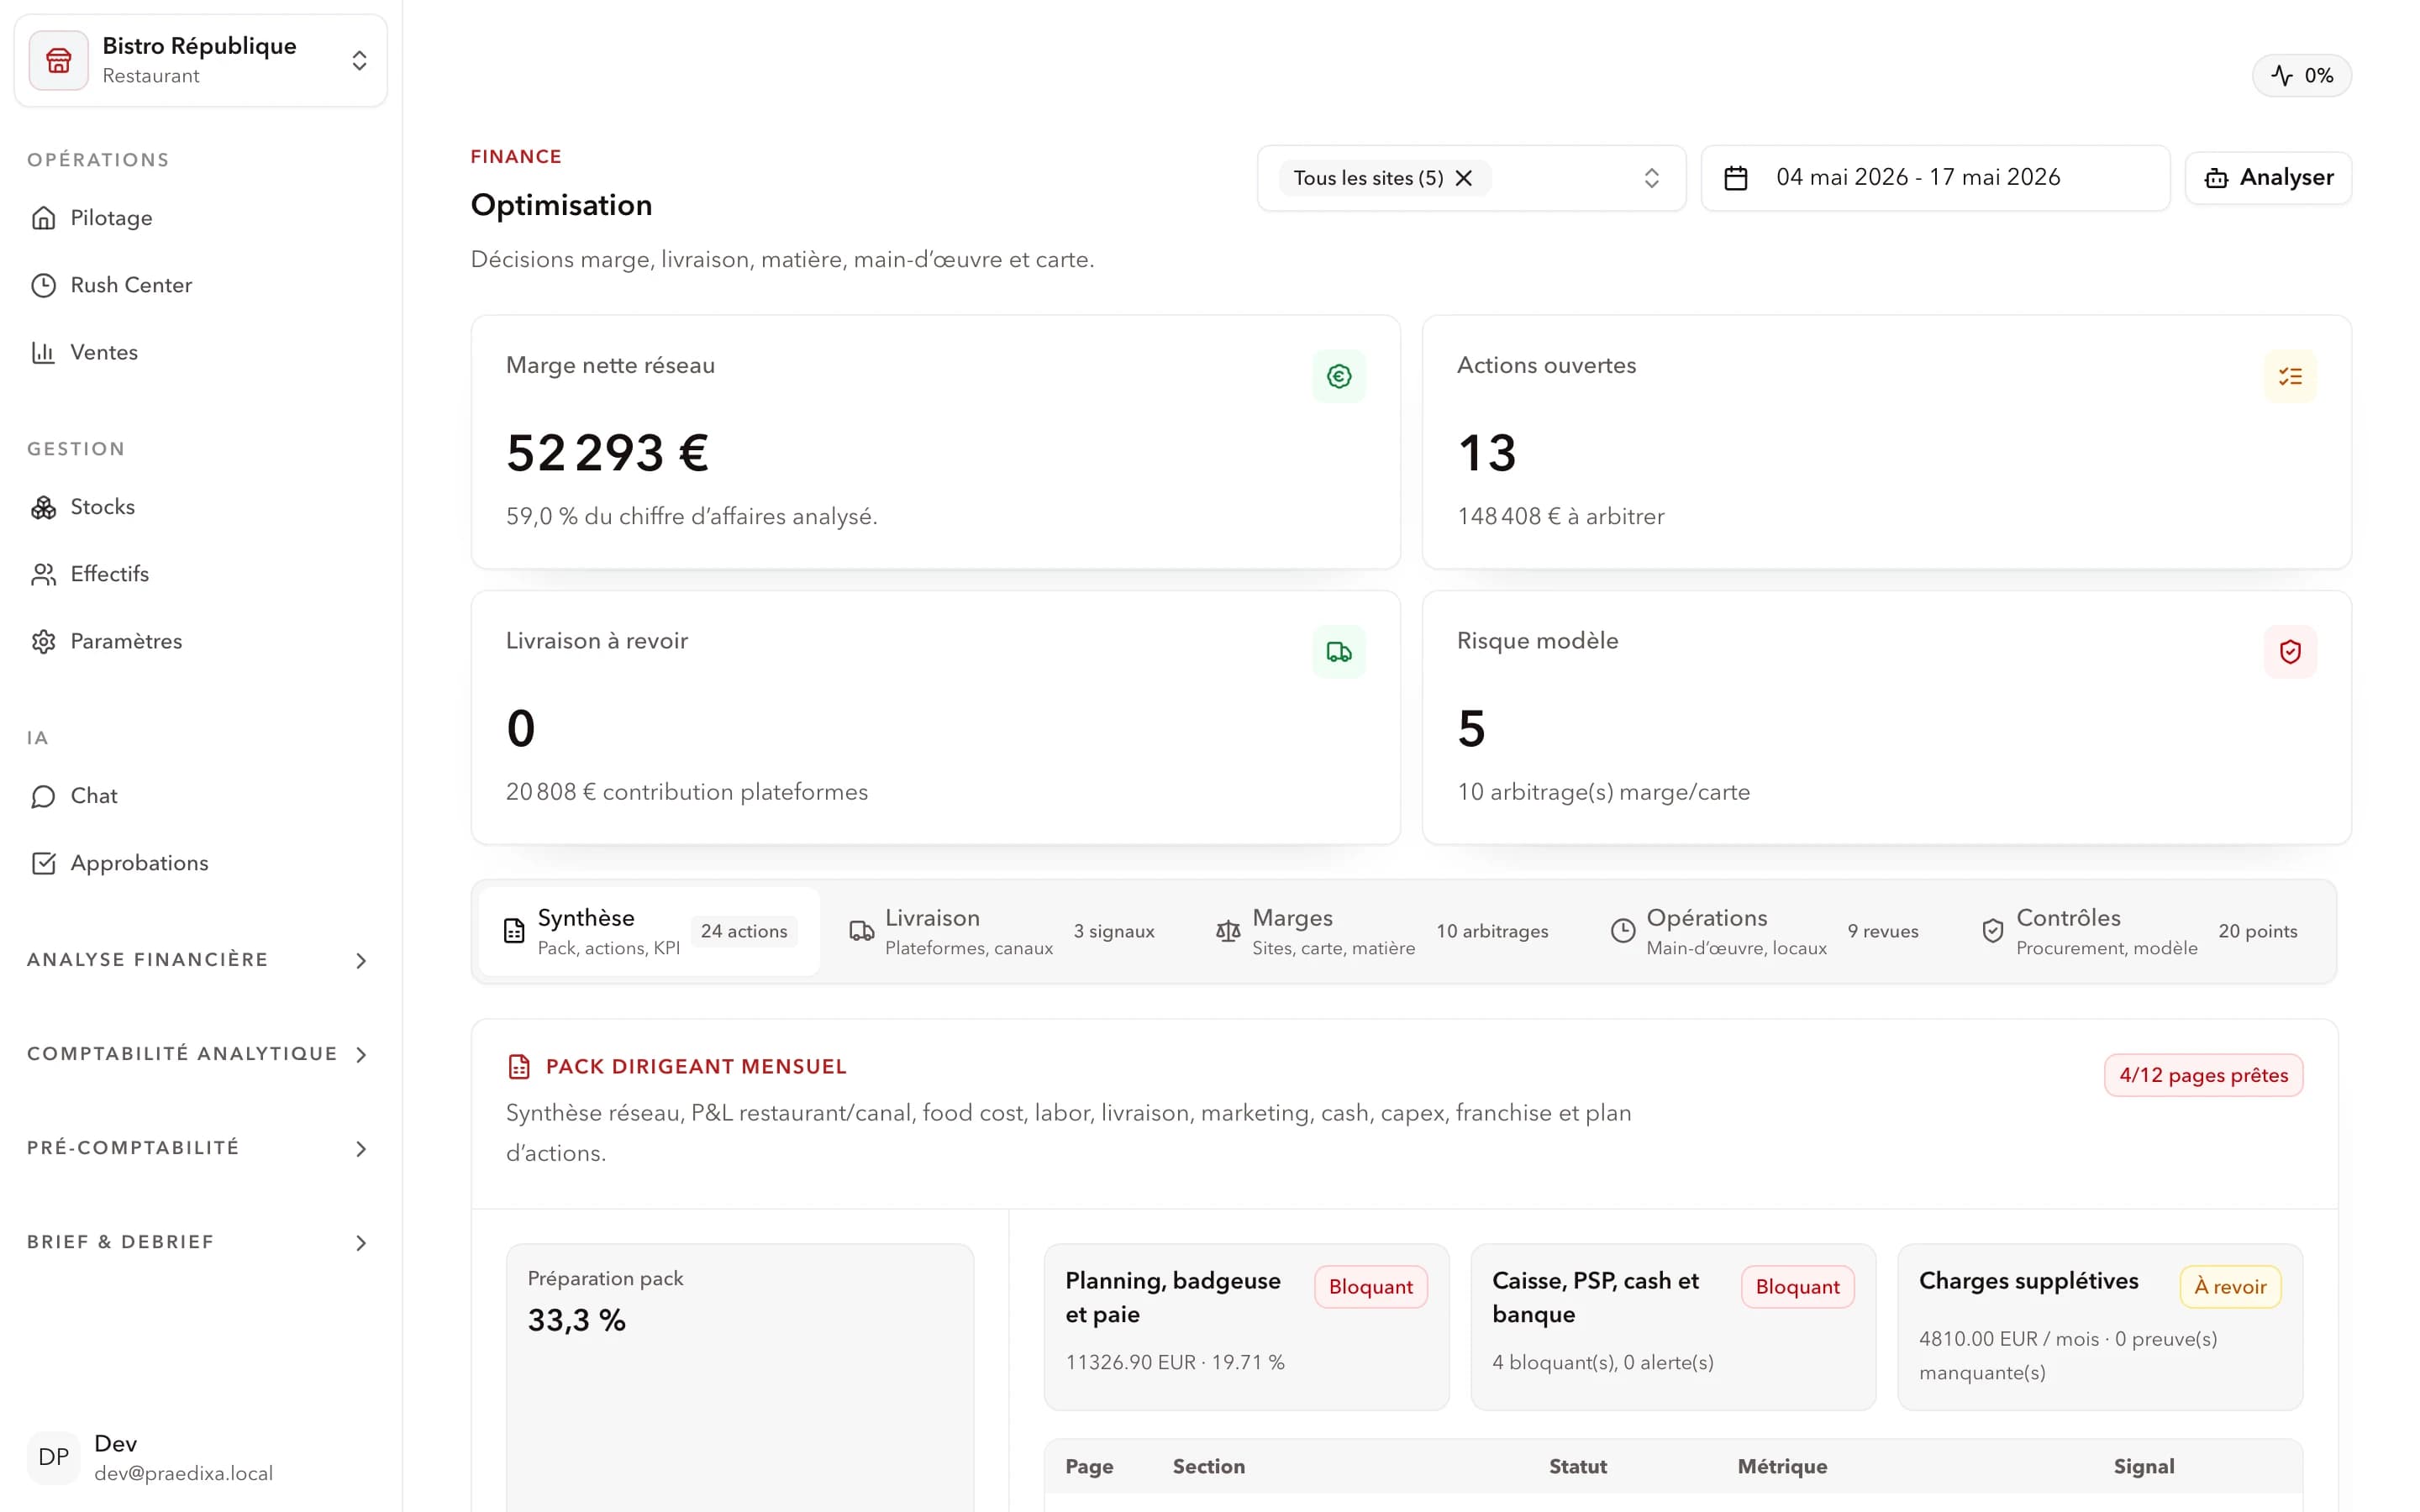
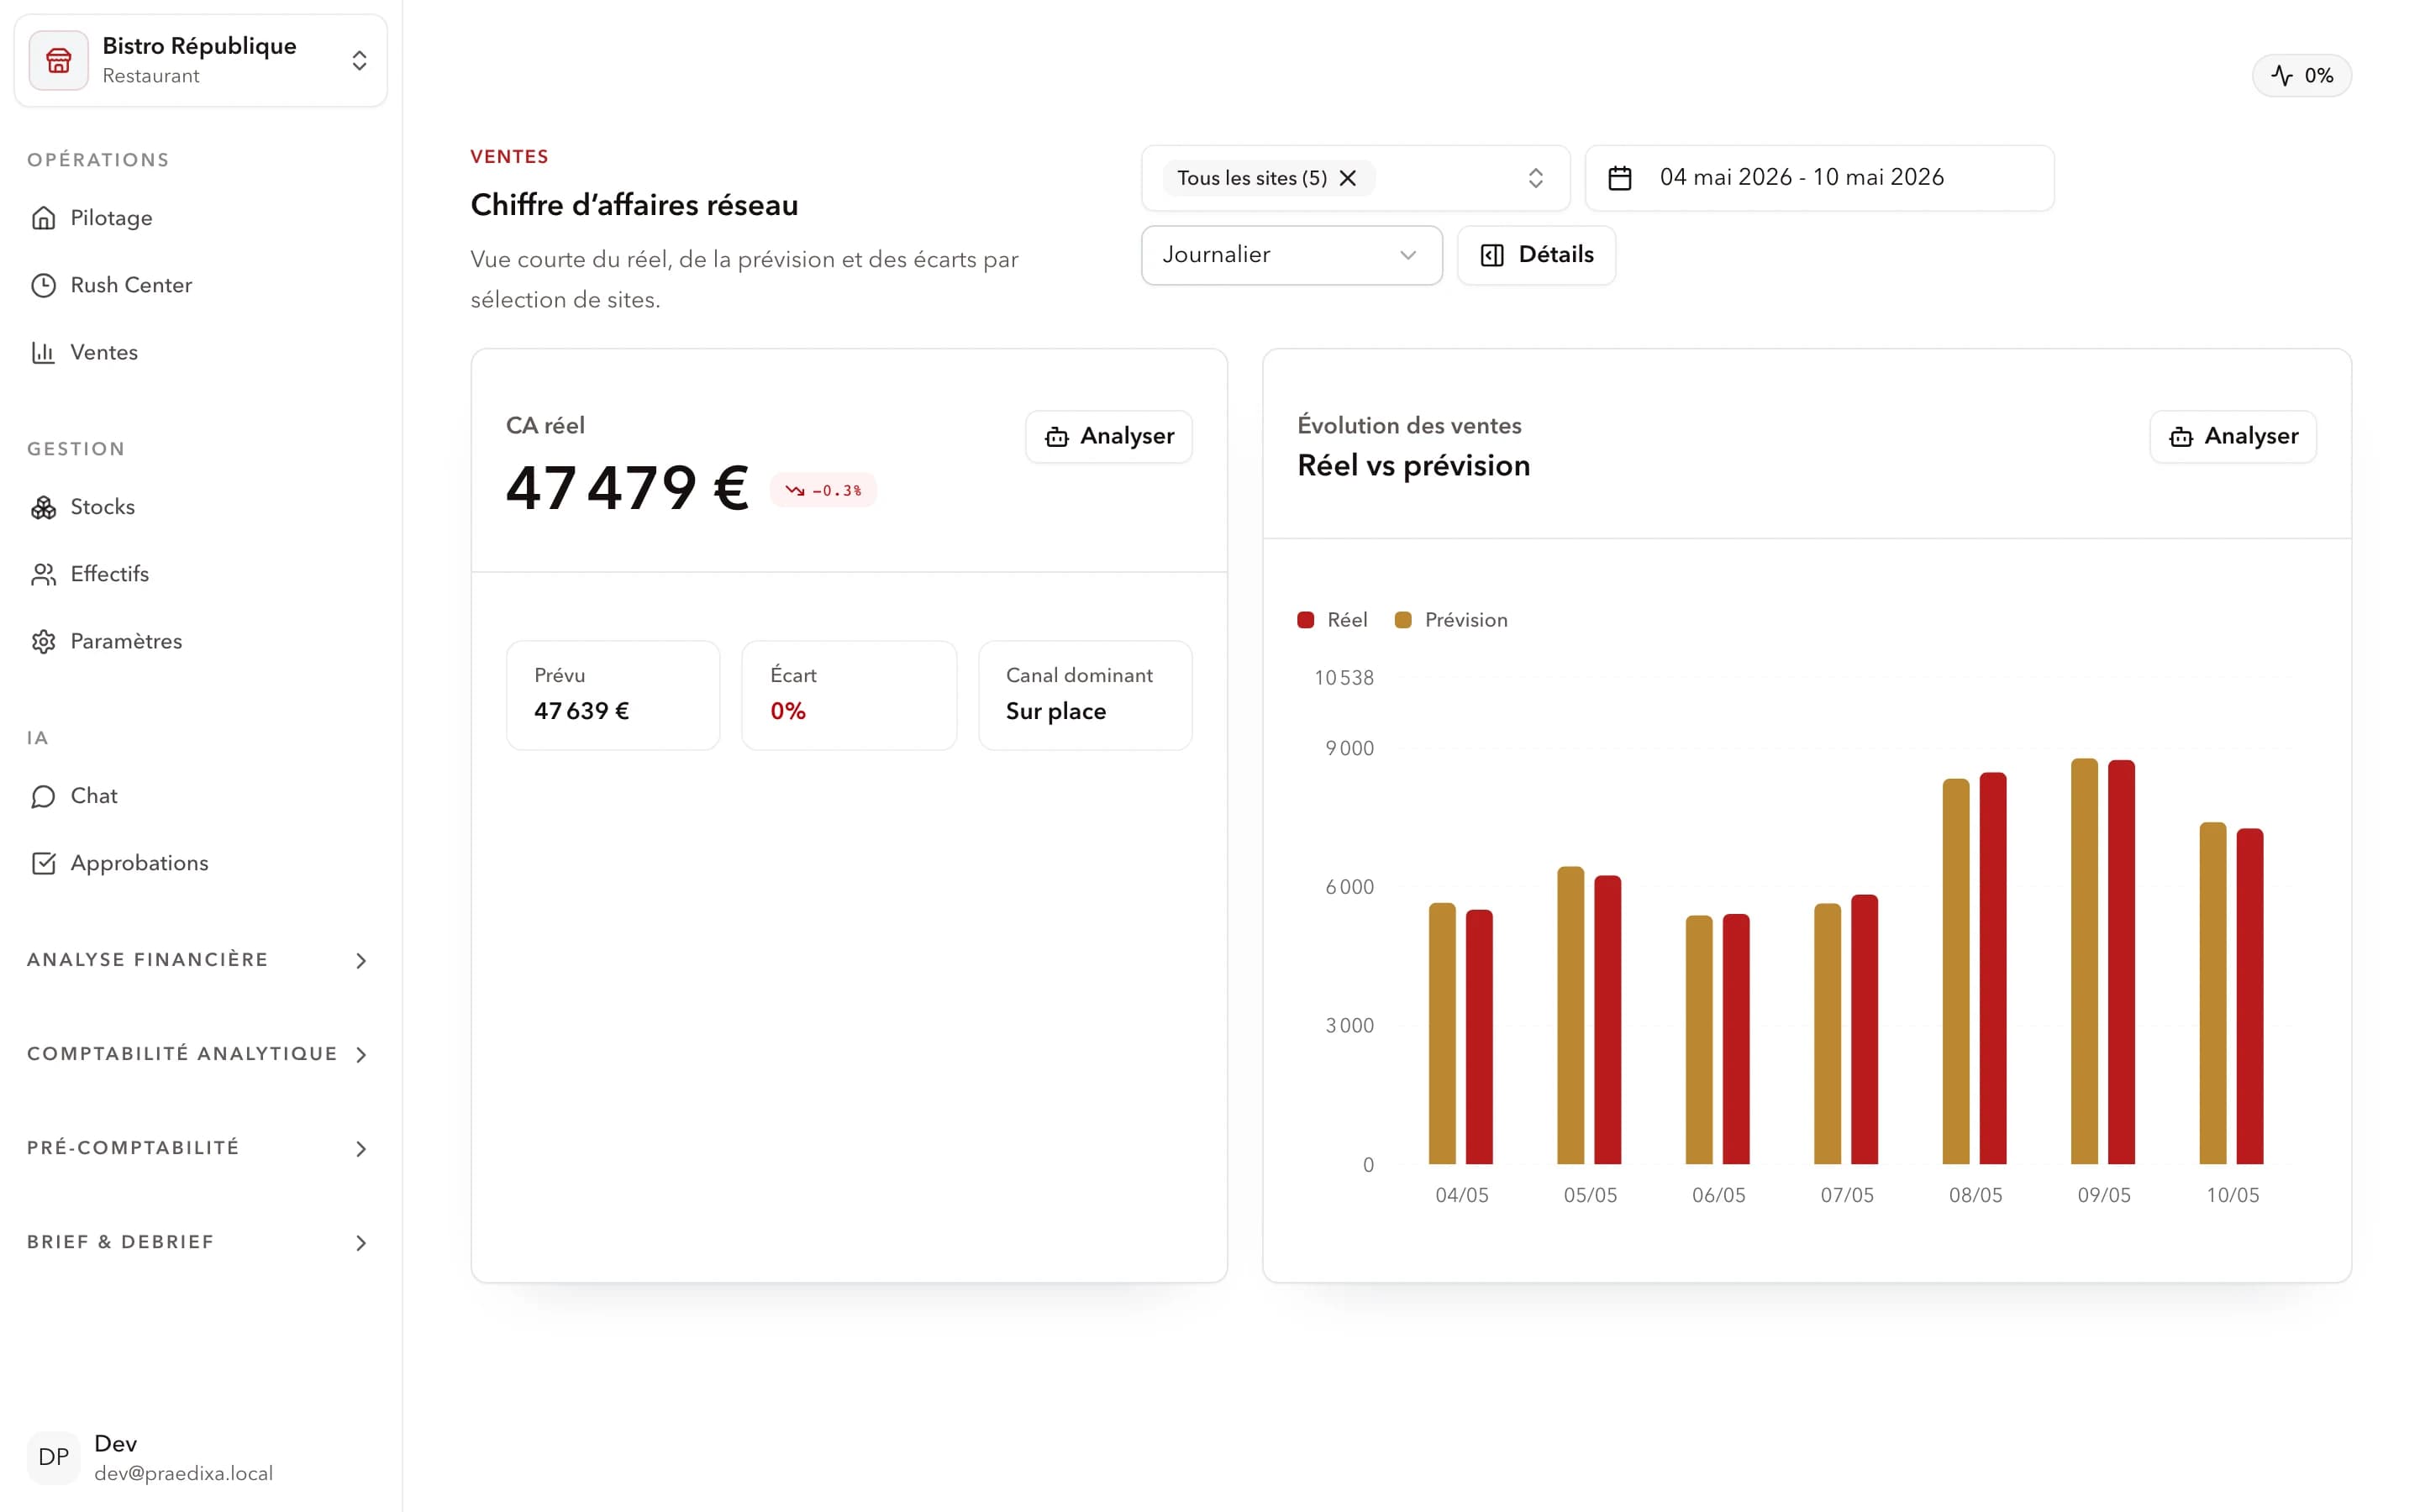
A gross margin gap above 5 points between two sites with comparable concept and revenue. When you see that, it's almost never a purchasing-price problem — it's a steering problem: non-standardized orders, locally-drifted recipes, unlogged waste. Past 3 or 4 sites, without a consolidated dashboard, heterogeneity sets in silently and nobody sees it before it costs 2–3 points of network margin.

Steven Poivre, CEO & Data Scientist — Time Series and Demand Forecasting Expert

How do you convince a franchisee to share operational data?

Three levers in this order: prove value BEFORE asking (an anonymized network benchmark showing where the franchisee gains or loses vs peers), guarantee reciprocity (they receive as much as they give, with their own local dashboard), and cap the shared scope at site-level aggregates (no individual or behavioral granularity). When a franchisee sees that a 4-point food cost gap vs the network costs them €30,000/year, they share willingly.

What's the most common mistake during a multi-site rollout?

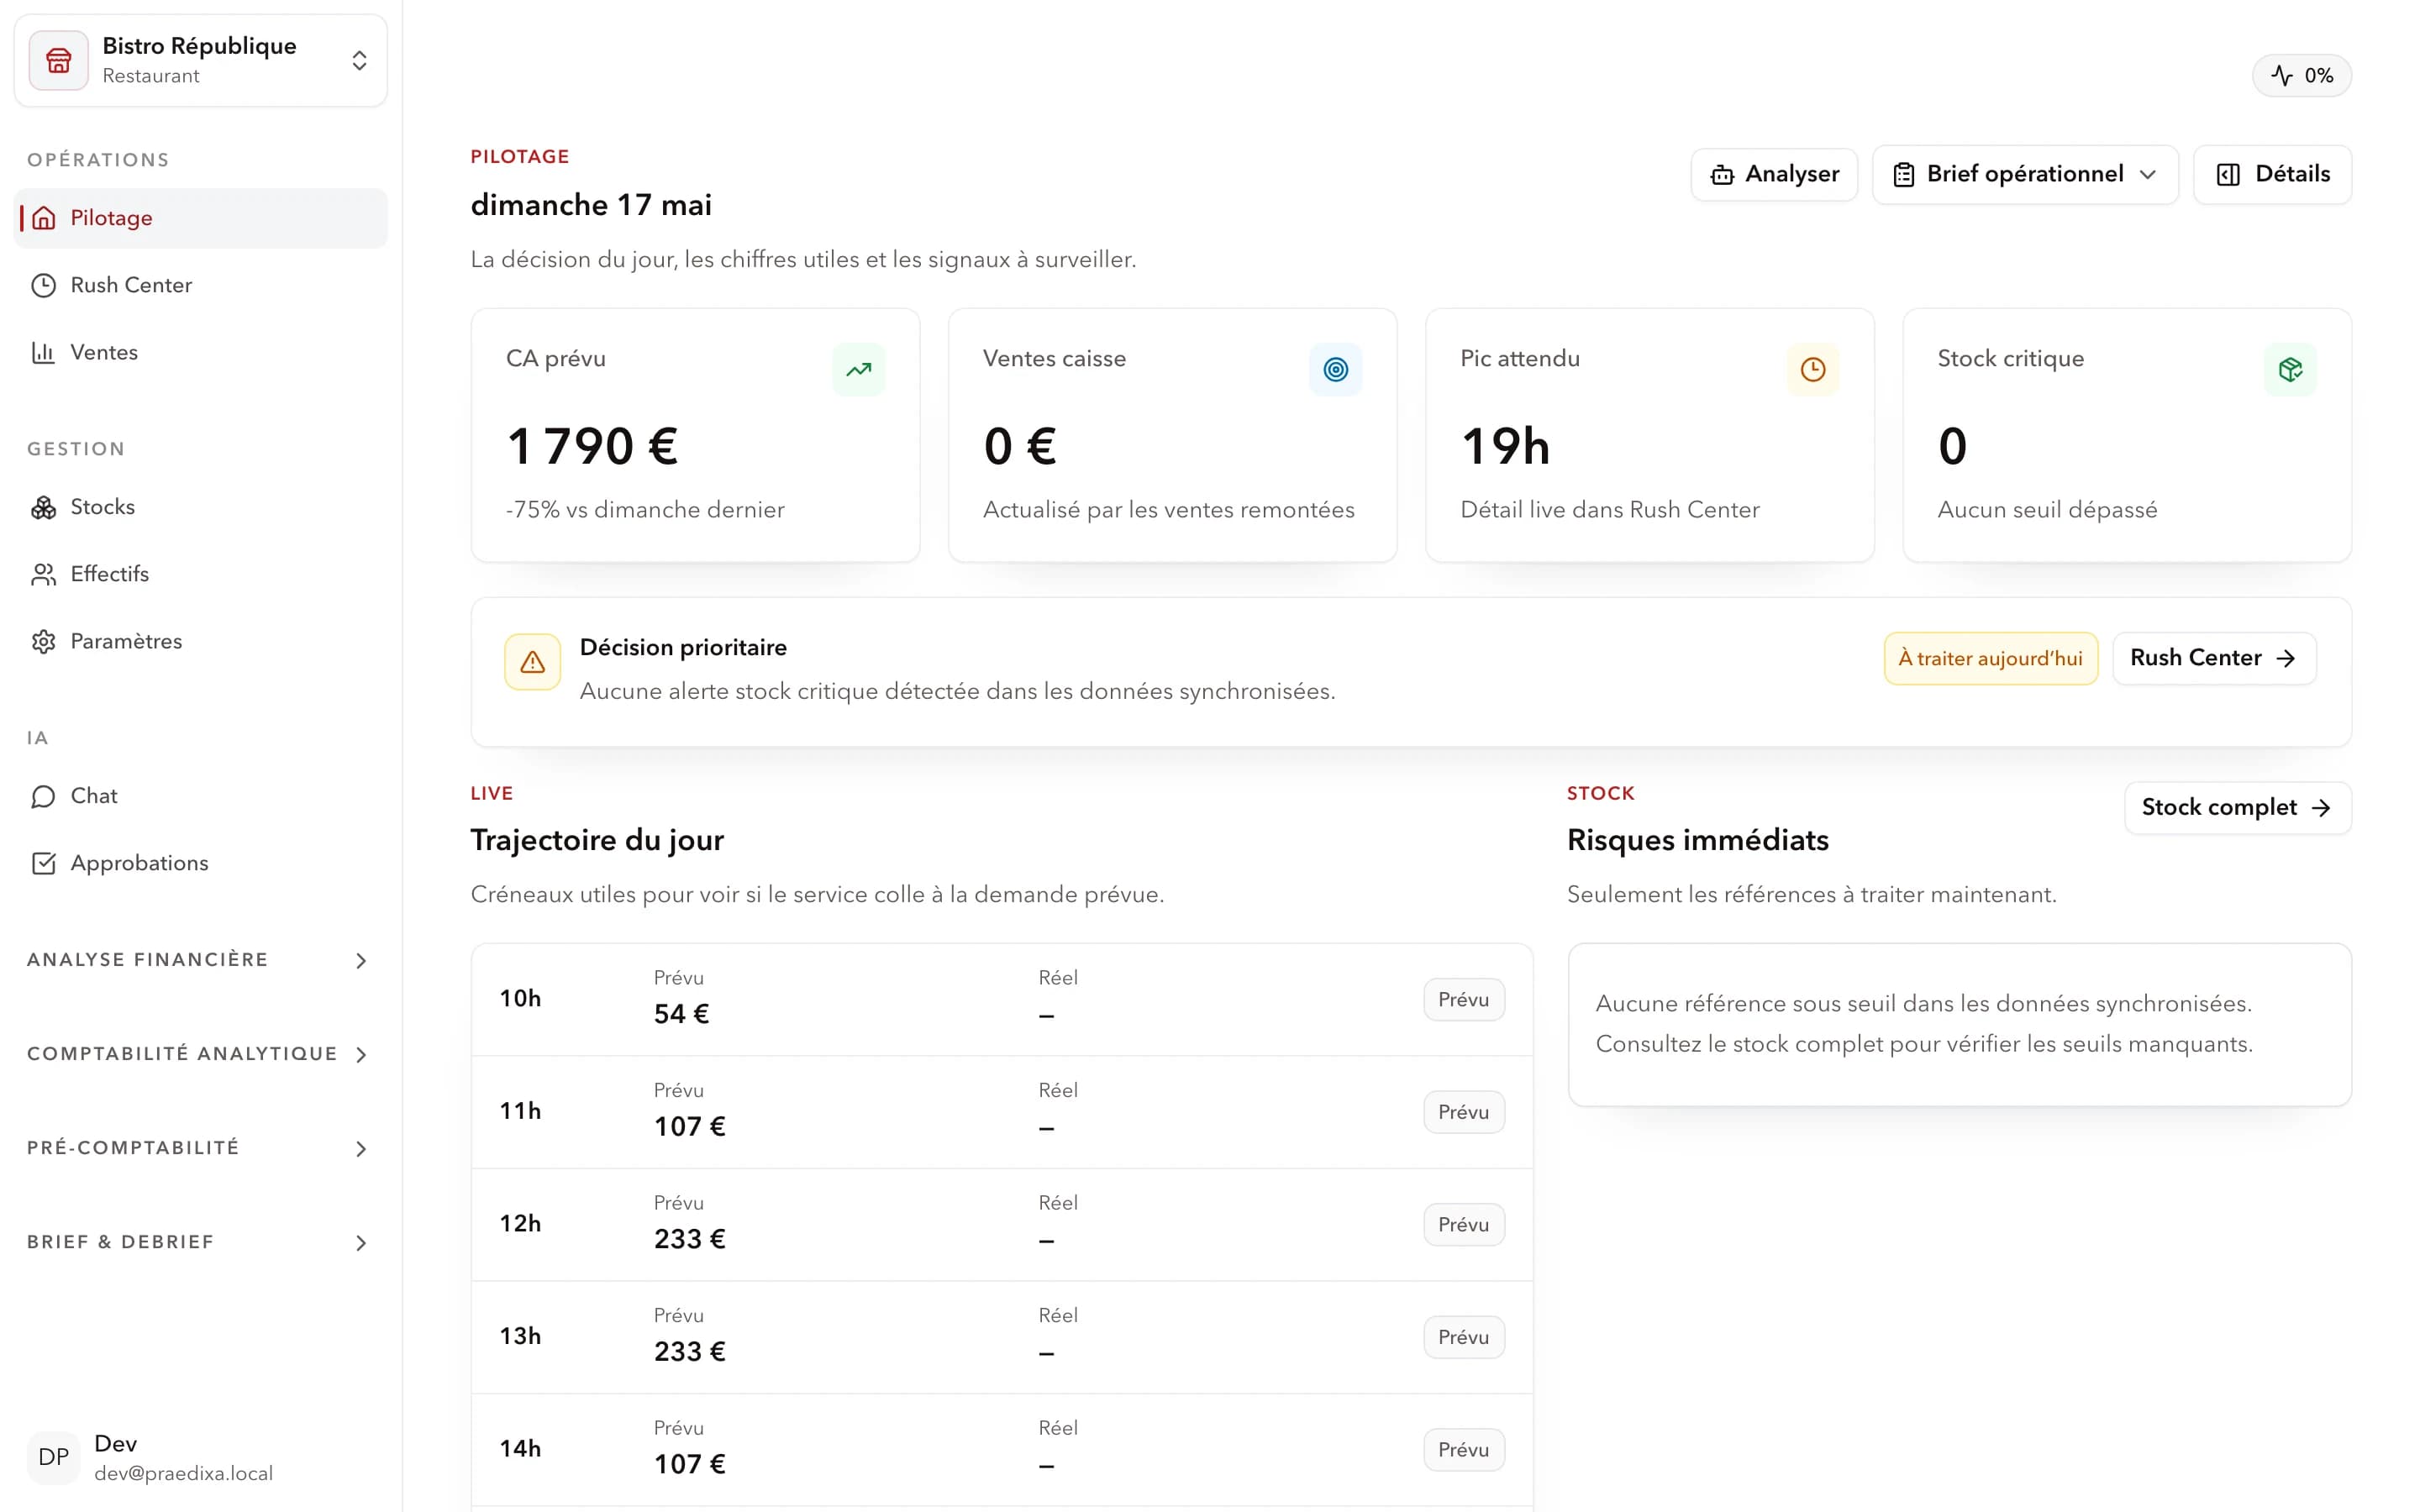
Trying to deploy everything at once. Successful rollouts start with 2–3 pilot sites for 30 days, measure one precise KPI (overstaffing, food cost, or forecast variance), then generalize. Failed rollouts want to wire 10 sites in week 1, with no measurable baseline, and drown local managers in change. The resistant franchisee is usually the one we didn't take time to onboard with a pilot.

The 4 multi-site restaurant steering tools in 2026

#1

Praedixa — forecasting + scheduling + centralized inventory Recommended

AI B2B platform designed for restaurant networks and franchises. Positioned upstream of HR tools (Skello, Combo) to anticipate, optimize and plan. Per-site demand forecasting (D+7, D+30), labor recommendations, centralized inventory management, multi-site reporting with automatic drift detection. Ideal for franchisors, operations directors, CFOs of 5–50 restaurant networks. Complements your stack — doesn't replace it.

ROIMeasured
J+7Lead time
#2

Lightspeed — multi-site POS and back-office

One of the few POS designed from day one for large-scale multi-site. Pro plan (from €349/month) with centralized activity view, consolidated inventory, comparative reporting. Advanced Insights for per-dish/server/hour profitability analysis. +100 integrations. Remote menu and promo updates across sites. Ideal for chains seeking powerful cloud POS — doesn't predict demand or plan labor proactively.

#3

Innovorder — multi-site fast-casual operations

100% French solution specialized in multi-site commercial and quick-service foodservice. 2,500+ locations in France (Amorino, Big Fernand, Bagel Corner). Complete ecosystem: POS, kiosks, click & collect, production screens. Data centralization, real-time inventory, centralized back-office. Ideal for high-volume fast-casual networks. Less suited to traditional dine-in. From €79/month/site.

#4

Adoria — network planning and purchasing

SaaS ERP dedicated to organized foodservice. Purchasing, inventory and production management at network scale. Built-in AI for supplier order recommendations accounting for consumption cycles, seasonality and per-site constraints. Purchasing/inventory/sales data warehouse, -20% order errors, multi-site BI reporting (margins, recipe variance, HACCP). Ideal for institutional and commercial restaurant groups from 10 sites. Not a customer demand forecaster nor an HR scheduler.

Multi-site restaurant steering software comparison

CriterionPraedixaLightspeedInnovorderAdoria
Labor scheduling🟡
Inventory management🟡
Multi-site reporting
Ideal forNetworks 5–50 sites, franchisesCloud POS chainsMulti-site fast-casualGroups 10+ sites, institutional
Indicative pricingOn requestFrom €69/monthFrom €79/site/monthOn request
ROI pilot

How to turn the comparison into a buying decision

The right way to evaluate software is not to start from a generic demo. The team should choose a narrow scope, for example a few restaurants, product families or a period with high volatility. That scope should be enough to test the critical signals: sales history, weather, calendar effects, promotions, known stockouts, labor constraints and expected service level.

Before comparing results, the team must define the decision that needs improvement. For a restaurant, that can be the quantity to purchase, preparation level, number of people per slot or acceptable stockout risk.

Tracking should stay simple: one line per recommendation, the decision taken, the difference from the usual practice and the observed effect.

INTERACTIVE

Which multi-site steering fits your network?

What is your network's number one priority today?

FAQ

FAQ — multi-site restaurant management

What is multi-site restaurant management?

Multi-site restaurant management is the set of methods and tools that let a restaurant network supervise, compare and optimize each site's performance from a central level. It covers financial performance (food cost, margins, revenue), operations (inventory, purchasing, production) and human resources (schedules, labor cost). Effective steering requires centralized data, standardized KPIs and real-time action capability on variance.

Which tool for multi-site restaurant management?

There is no single universal tool. In 2026, top networks use a specialized ecosystem: Praedixa for demand forecasting, labor scheduling and centralized inventory; Lightspeed for POS, back-office and multi-site POS reporting; Innovorder for multi-site fast-casual operations; Adoria for purchasing, supply and food cost control. Choice depends on your model (franchise, chain, fast-casual or traditional) and network size.

How to standardize performance across sites?

Standardization takes three steps. First, define a common reference framework: same KPIs, same formulas (food cost, labor cost, average ticket) across all sites. Then centralize data: connect POS, inventory and HR in a single platform to avoid local calculation bias. Finally, compare in real time: a network dashboard surfaces drifting sites before the situation degrades.

Does Praedixa work for franchises?

Yes. Praedixa is designed for multi-site restaurant networks and franchises. The franchisor steers global network performance while local managers retain visibility on their own location. Praedixa complements existing HR tools (Skello, Combo) — it anticipates demand and optimizes resources upstream, without replacing payroll or HR management tools.

What ROI to expect from a network steering tool?

Results vary by network size and operational maturity. Based on representative scenarios for 5–50 restaurant networks: -10 to -20% on labor cost through better staffing/demand alignment; -15 to -25% food waste through better-calibrated orders; +3 to +6 points of gross margin through food cost standardization. Observable ROI from 60–90 days in most cases — faster as network size grows.

Ready to take action?

Your competitors will make these decisions 14 days in advance. Will you?

Free 30-minute demo. We show you your data, your forecasts, your first alerts. Not a pitch — a concrete demonstration on your sector.

30-minute demo · No commitment · Data hosted in France

  • Fast pilot kickoff
  • Native POS connection
  • Measurable ROI